
Figure 1. β subunit expression in MCF-7 and MDA-MB-231 cells.
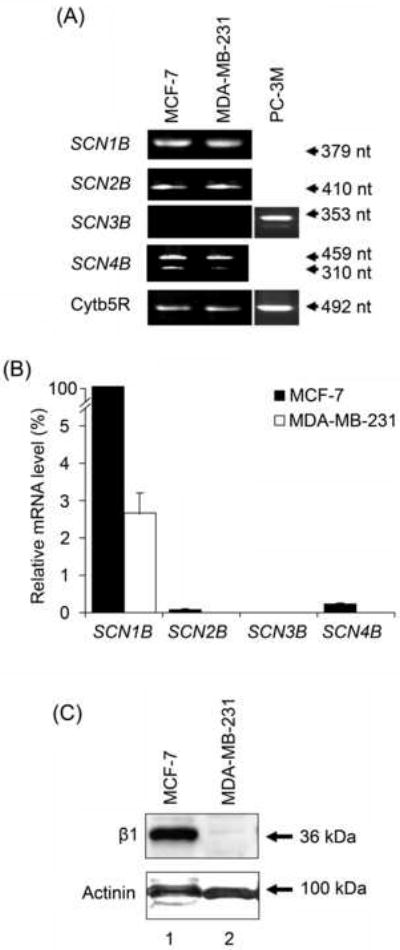
(A) Typical gel images of PCR products, taken at the end of the PCR, for SCN1B, SCN2B, SCN3B, SCN4B and cytochrome b5-reductase (Cytb5R) from MCF-7, MDA-MB-231 and PC-3M cells. The PC-3M cell line was used as a positive control for SCN3B expression (Diss et al., 2007). (B) Relative mRNA levels of SCN1B, SCN2B, SCN3B and SCN4B, normalised to Cytb5R by the 2-ΔΔCt method, and expressed as a percentage of the SCN1B mRNA level in MCF-7 cells (fixed as 100 %). Each histobar indicates mean + error propagated through the 2-ΔΔCt analysis (n = 3). Significance is shown in Table 1. (C) Western blot with 70 μg of total protein per lane from MCF-7 and MDA-MB-231 cells, using β1ex and an actinin antibody as a control for loading. The same membrane was stripped and re-blotted.