
Figure 4. Effect of RNAi targeting SCN1B on the nNav1.5 protein level in MCF-7 cells.
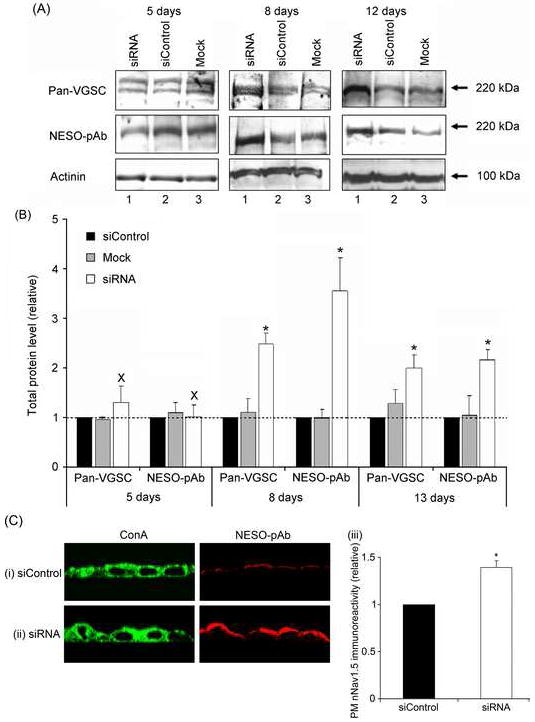
(A) Western blots with 80 μg of total protein per lane from cells 5, 8 and 12 days after treatment. For each case, lane 1, treatment with ‘mock’ control (no siRNA); lane 2, treatment with non-targeting siControl siRNA; and lane 3, treatment with siRNA targeting SCN1B. Antibodies used were pan-VGSC (for total VGSC), NESO-pAb for nNav1.5 and an actinin antibody for loading control. The same membrane was stripped and re-blotted. (B) Quantification of the data shown in (A). Relative total VGSC α subunit and nNav1.5 protein levels normalised to the actinin control. (C) Typical confocal XZY images of non-permeablised MCF-7 cells 8 days after transfection with (i) non-targeting siControl siRNA or (ii) siRNA targeting SCN1B double-immunolabelled with conA plasma membrane marker (left) and NESO-pAb (right); (iii), Relative peripheral nNav1.5 level, measured from the confocal XZY images. Data are presented as mean and SEM [(B), n = 4; (C), n = 3]. Significance: (*) P < 0.05; (B), ANOVA with Newman-Keuls; (C) Student’s paired t-test.