
Figure 7. Effect of β1 on VGSC activity in MDA-MB-231 cells.
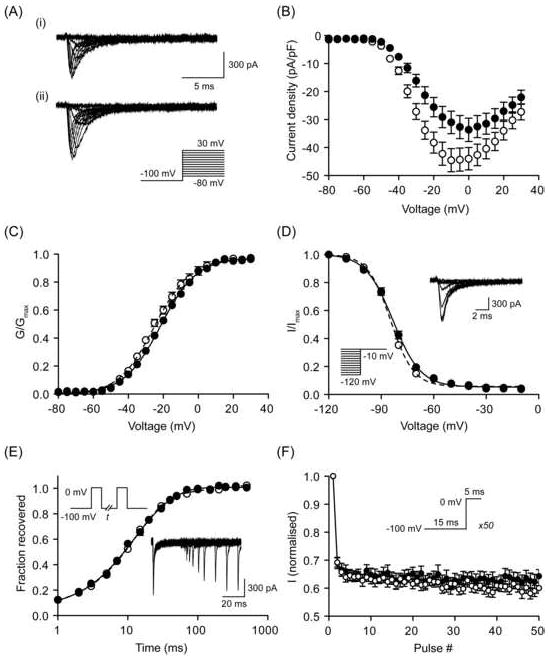
(A) Typical whole-cell Na+ currents elicited by 60 ms depolarizing voltage pulses between -80 mV and +30 mV applied from a holding potential of -100 mV: (i) a control cell expressing eGFP; (ii) a cell expressing β1-eGFP. (B) Current-voltage relationship. Peak Na+ current density was plotted as a function of voltage for control cells expressing eGFP (filled circles) and cells expressing β1-eGFP (open circles). (C) Activation. Normalised conductance (G/Gmax), calculated from the current data, plotted as a function of voltage for control cells expressing eGFP (filled circles) and cells expressing β1-eGFP (open circles). (D) Steady-state inactivation. Normalised current (I/Imax), elicited by 60 ms test pulses at - 10 mV following 1 s conditioning voltage pulses between -120 and -10 mV, applied from a holding potential of -100 mV, plotted as a function of the prepulse voltage for control cells expressing eGFP (filled circles) and cells expressing β1-eGFP (open circles). Inset, typical recording from a control cell. (E) Recovery from inactivation. The fraction recovered (It/I0) was determined by a 25 ms pulse to 0 mV (I0), followed by a recovery pulse to -100 mV for 1-500 ms, and a subsequent 25 ms test pulse to 0 mV (It), applied from a holding potential of -100 mV, and plotted as a function of the recovery interval for control cells expressing eGFP (filled circles) and cells expressing β1-eGFP (open circles). Inset, typical recording from a control cell. (F) Use-dependent rundown. Current (I), elicited by 50 Hz pulse trains to 0 mV, applied from a holding potential of-100 mV, normalised to the current evoked by the first pulse plotted as a function of the pulse number for control cells expressing eGFP (filled circles) and cells expressing β1-eGFP (open circles). Control (solid lines) and β1-eGFP (dashed lines) data are fitted with Boltzmann functions, (C) and (D); and double exponential functions, (E). Data are presented as mean ± SEM (n = 20).