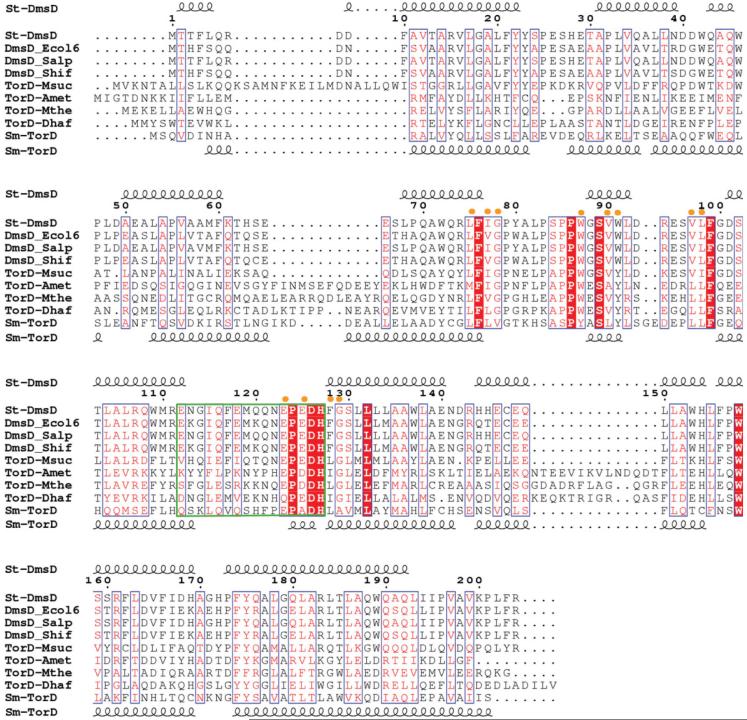
Figure 2.
ClustalW alignment of St-DmsD and TorD homologues (gi|67460417| from S. typhimurium, gi|67460400| from E. coli, gi|67460198| from S. paratyphi, gi|67476814| from S. flexneri, gi|52426390| from M. succiniciproducens, gi|77684993| from A. metalliredigenes, gi |83590226| from M. thermoacetica, gi|68206032| from D. hafniense, gi|47117367| TorD from S. massilia). The E-value is below 1 × 10⁻⁵. The secondary structure of St-DmsD is shown on the top and Sm-TorD on the bottom. The nine identical residues are highlighted in red, and the 12 highly conserved residues spatially close to the identical residues are indicated by yellow dots on top of the aligned sequences. The green box defines the flexible loop/hinge region between N-terminal and C-terminal moieties.

