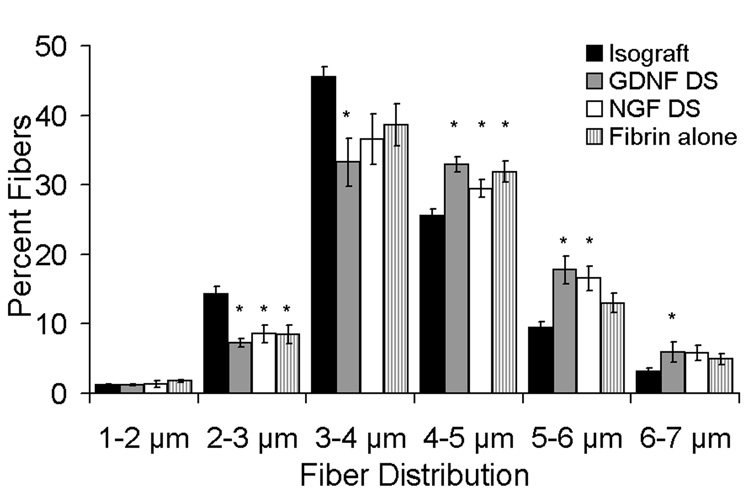
Fig. 4.
Myelinated fiber size distribution of regenerating nerves at the midline of the conduit (or graft). The nerve fiber width was measured by quantitative histomorphometry. The percentage of large regenerating nerve fibers (4–5, 5–6 µm) were larger in the GDNF DS and NGF DS groups compared to the isograft group. GDNF DS had significantly the greatest percentage of the largest fibers (6–7µm) compared to the isograft. Data (n = 12) are shown as mean ± SEM. *Statistical significance (p < 0.05) compared to the isograft.

