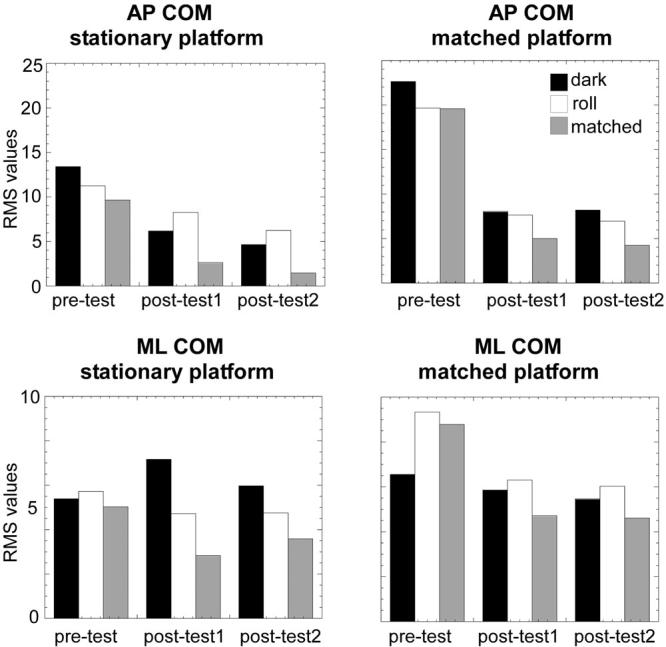
FIGURE 5.

Bar graphs of the center of mass (COM) root mean square (RMS) in the anteroposterior (AP; top plots) and mediolateral (ML; bottom plots) directions when the platform was stationary (left) or matched to the motion of the COM (right) and the scene was dark (black bars), rotating counterclockwise (white bars), and matched to the motion of the head (gray bars) for each of the three test periods.
