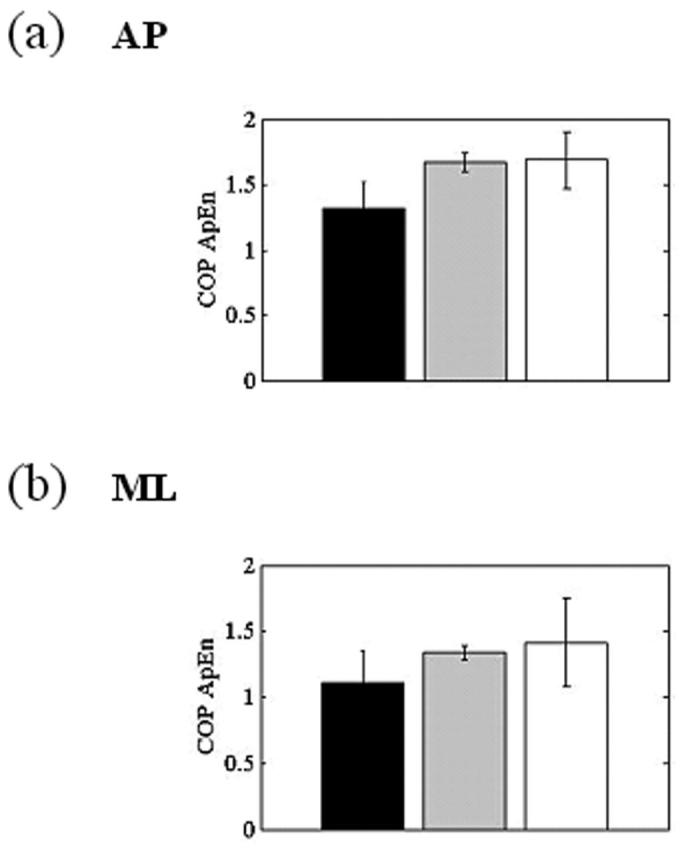
FIGURE 6.

Bar graphs of the mean and standard deviations of the center of pressure (COP) approximate entropy responses for the three test periods in the anteroposterior (AP; a) and mediolateral (ML; b) directions when motion of the platform was matched to motion of the center of mass.
