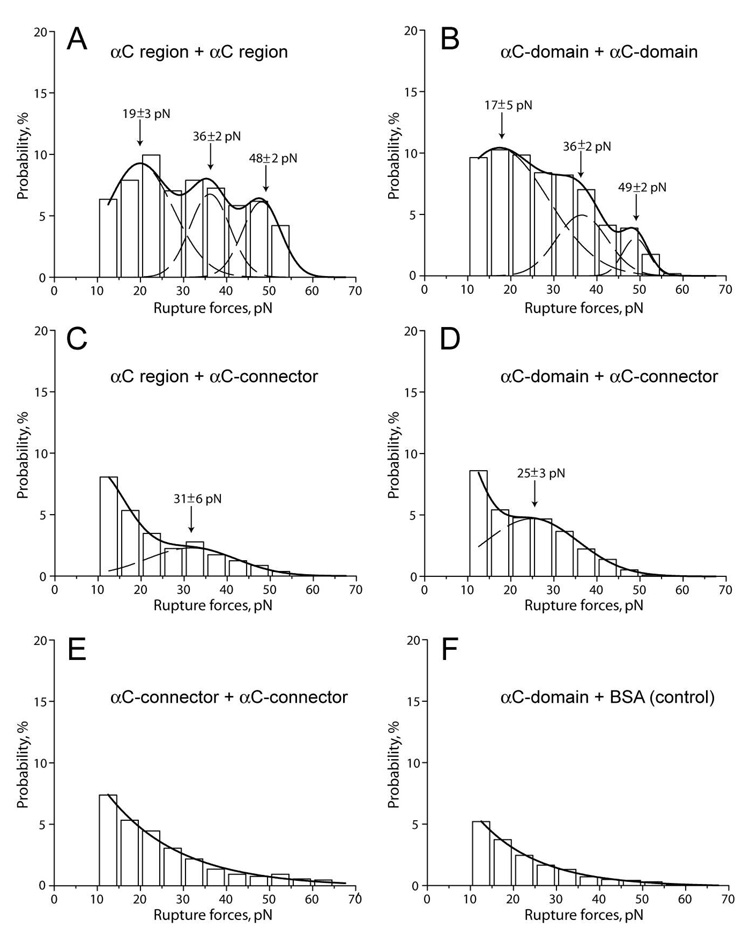
Figure 4. The panel of rupture force histograms demonstrating interactions of the αC region and its sub-fragments, αC-domain and αC-connector.
A - interactions of the pedestal-bound αC region with the αC region coupled to a bead; B - the pedestal-bound αC-domain with the αC-domain coupled to a bead; C, D, and E – the pedestal-bound αC region, αC-domain, and αC-connector with the αC-connector coupled to a bead, respectively; F - the pedestal-bound αC-domain with the BSA-coated bead (negative control). The dashed lines show the fitting with Gaussian curves to determine the position of each peak that corresponds to the most probable rupture force.

