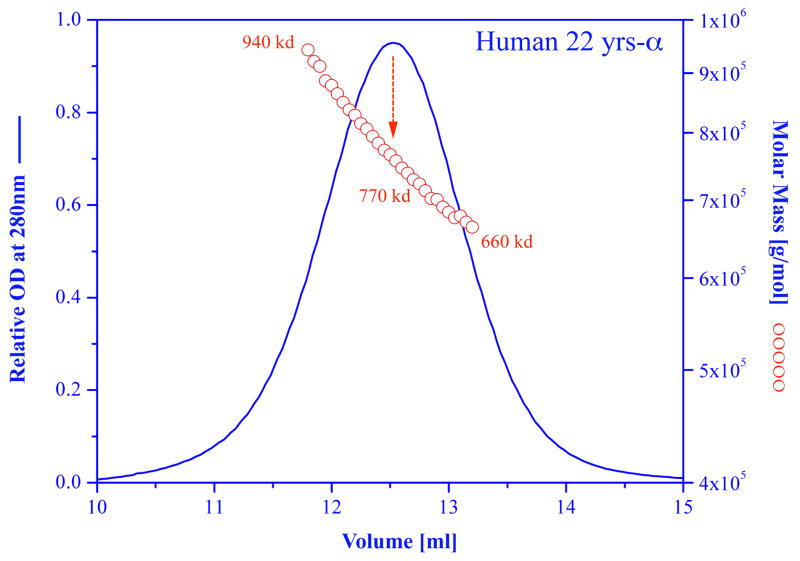
Figure 1.
Molar mass distribution plot and absorption at 280 nm for a sample of human (22 years) alpha crystallin. Size exclusion chromatography was carried out on a GE Healthcare Superose HR6 column connected in line with an absorption detector, a multi-angle laser light scattering detector, and a refractive index detector (DAWN-EOS; Optilab-DSP system, Wyatt Technology Corp, Santa Barbara, California USA). The blue curve represents the absorption of the sample as it is being eluted from the column. The red circles represent the molar mass of each fraction. For more details see Wen et al., 1996, Horwitz, 2003.

