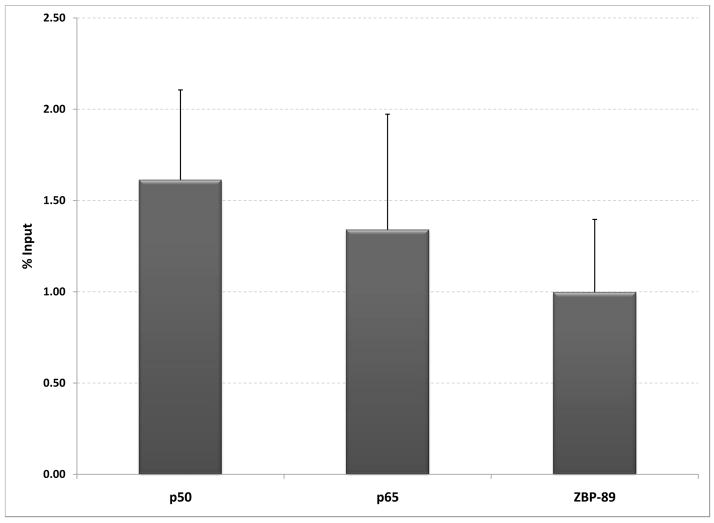
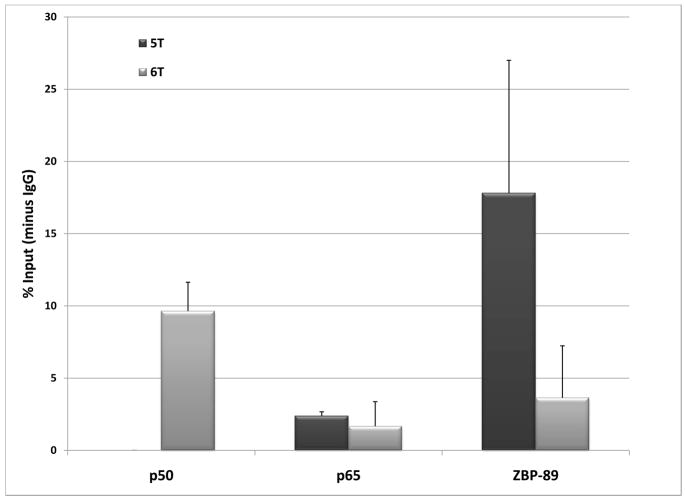
Figure 1. Chromatin immunoprecipitation.
A. An HFF cell line was shown be homozygous 6T/6T. Shown are results from 4 independent ChIP assays, using antibodies against p50, p65 and ZBP-89/ZNF148. Results were quantitated by real-time PCR, and normalized to results obtained for RNA polymerase II binding to the GAPDH proximal promoter. The graph shows % input +/− SEM. B. COS-1 cells were transfected with 5T or 6TStro plasmids containing 2 kb of the human MMP-3 promoter and ChIP assays were performed. Immunoprecipitated fragments, or input fractions, were amplified by PCR and run on agarose gels. Quantitation of ethidium bromide stained gels was performed by ImageJ software. The graph shows results from three independent experiments, as % input with results from IgG non-specific immunoprecipitation subtracted, +/− SEM.


