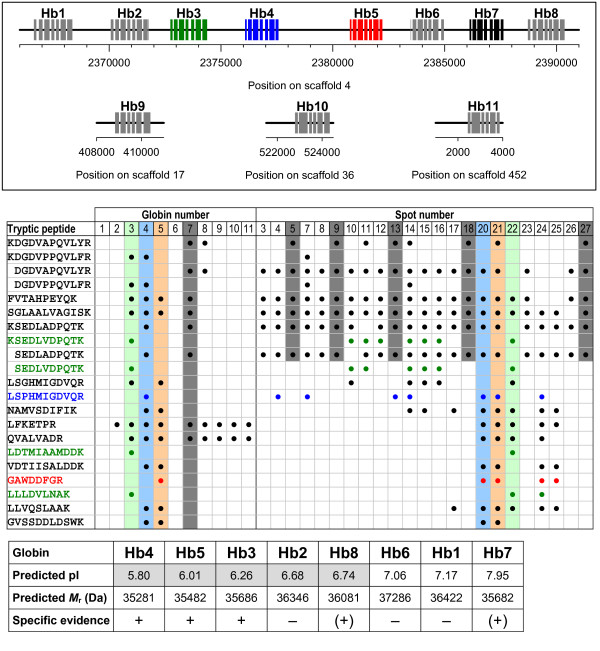
Figure 2.
Assignment of protein spots to the globin genes (HbA-HbL) of D. pulex. Positional information on the globin genes (Hb1–Hb11) is given on top (boxes represent exons). Genes with specific proteomic support (Hb3, Hb4, Hb5) are shown in green, blue and red colors. The middle part lists the tryptic peptides in the order of their appearance in the globin sequences. Black circles indicate the occurrence of tryptic peptides in the globin sequences and in the analyzed spots. Colored sequences and circles indicate tryptic peptides that are specific for only one globin. Shaded in gray is a set of six tryptic fragments which were detected in several spots (5, 9, 13, 18, 27) and which could all be assigned to subunit Hb7. The lower part lists the characteristics of globins in terms of predicted isoelectric point (pI) and molecular mass (Mr). Shaded in gray are the predicted pI values which fall within the pH 4–7 gradient range used for isoelectric focussing.

