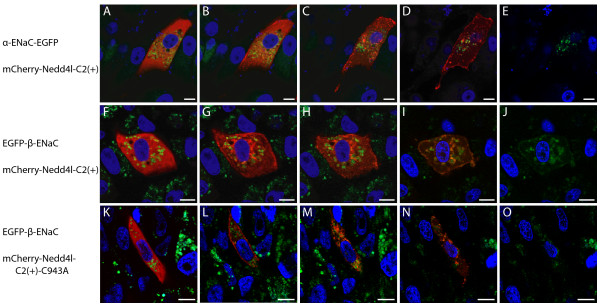
Figure 5.
Distinct subcellular localization behaviors of EGFP tagged α- and β-ENaC and mCherry tagged NEDD4L-C2(+) or NEDD4L-C2(+)-C943A in response to an ionomycin treatment in the presence of Ca2+. Confocal images of live A6 cells stably expressing α-ENaC-EGFP (A-E) or EGFP-β-ENaC (F-J, K-O) transiently transfected with mCherry-NEDD4L-C2(+) (A-E, F-J) or mCherry-NEDD4L-C2(+)-C943A (K-O) and incubated in 1.97 mM Ca2+. The images were acquired at 0 (A), 30 (B), 210 (C), 420 (D, E), 0 (F), 41 (G), 66 (H), 236 (I, J), 0 (K), 80 (L), 120 (M), and 240 (N, O)seconds after a 10 μM ionomycin addition. All images are overlays of the blue, green and red channels except for images E, J, and Owhich show only the blue and green channels.

