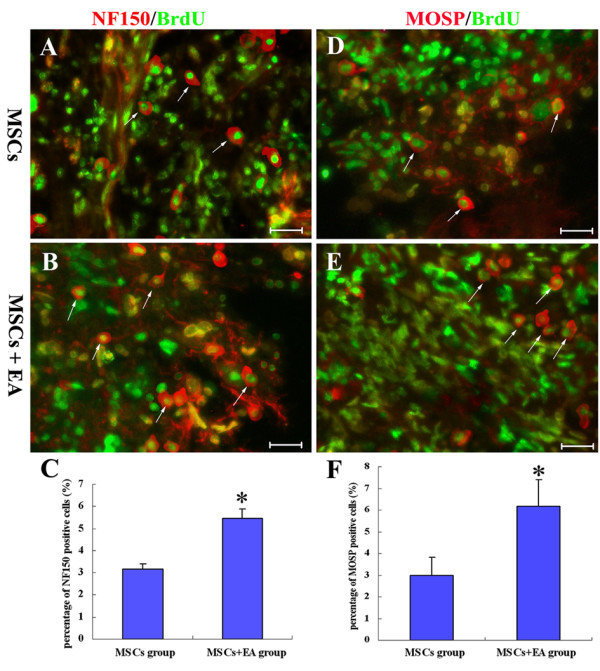
Figure 7.

Differentiation of MSCs into neuron-like and oligodendrocyte-like cells at 8 weeks following transplantation. A and B: NF150 (red) and BrdU (green) double-labeling show the NF150-positive neuron-like cells (arrows) in the MSCs group (A) and MSCs+EA (B) group. Cell number counting indicates the number of NF150/BrdU double-labeled cells was significantly higher in the MSCs+EA group compared to the MSCs group (C, * indicates P < 0.05). D and E: MOSP (red) and BrdU (green) double-labeling show the MOSP-positive oligodendrocyte-like cells (arrows) in the MSCs group (D) and MSCs+EA group (E). Cell number counting indicates the number of MOSP/BrdU double-labeled cells was significantly higher in the MSCs+EA group as compared to the MSCs group (F, * indicates P < 0.05). Data= means ± SD. Scale bars: A, B, D, E = 20 μm.
