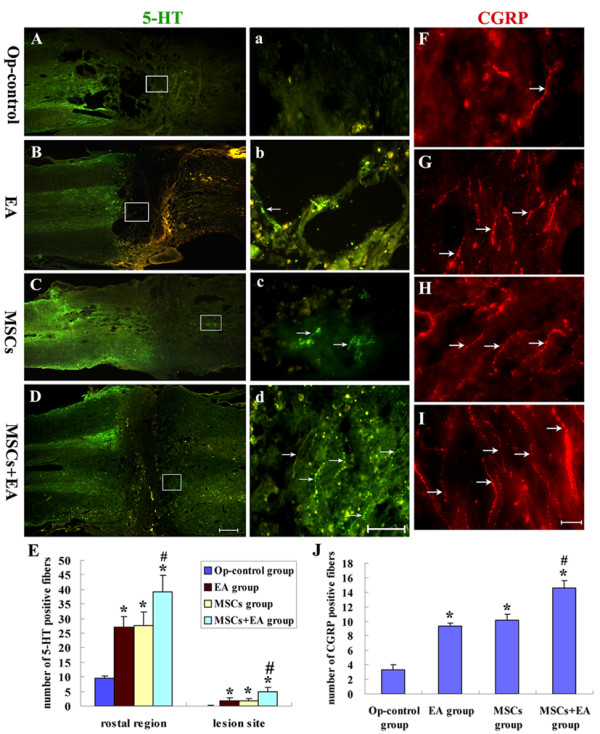
Figure 9.

5-HT and CGRP-positive nerve fibers in the injured spinal cord at 8 weeks following surgery. A-D: A longitudinal section of spinal cord shows 5-HT positive fibers in the Op-control group (A), EA group (B), MSCs group (C), and MSCs+EA group (D). a-d: Higher magnification of the rectangle boxes in Fig. A-D. Scale bars: A, B, C, D = 320 μm; a, b, c, d = 40 μm. E: Comparison of the number of 5-HT positive fibers in the lesion site and the region immediately rostral to the lesion site among the 4 groups (MSCs+EA vs. Op-control group, * indicates P < 0.01; MSCs+EA vs. MSCs or EA groups: # indicates P < 0.05). F-I: A longitudinal section of spinal cord shows CGRP-positive fibers (arrows) in the Op-control group (F), EA group (G), MSCs group (H), and MSCs+EA group (I). Scale bars: F, G, H, I = 20 μm. J:Comparison of the number of CGRP-positive fibers located in the lesion site in the 4 groups (MSCs+EA vs. Op-control group, *indicates P < 0.001; MSCs+EA vs. EA or MSCs groups, # indicates P < 0.001).
