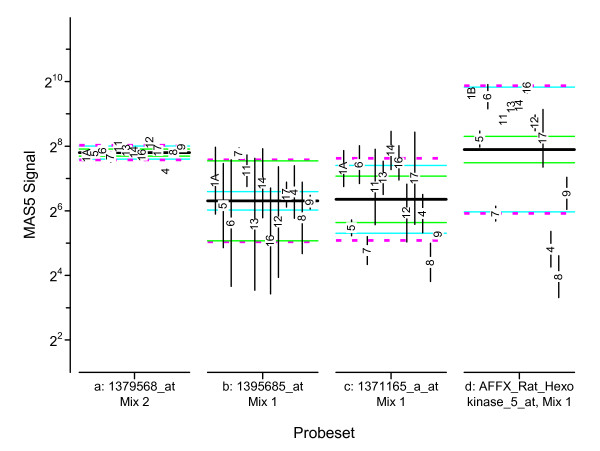
Figure 10.
Example graphical analysis of between-round precisions for individual probesets. The left section of each panel displays dot-and-bar charts for the three rounds in the format used in Figure 8. The right section displays the same participant average and standard deviation dot-and-bar data, but grouped by participant rather than round. The mid-line of the box around the data for each participant represents that participant's average,  ; the lower and upper edges of the box denote the intermediate precision over time, sI(T)j. The grand average,
  , is represented as a think black line; the repeatability, sr, as solid green lines; the between-participant precision, sL, as solid light-blue lines; and the reproducibility, sR, as dashed magenta lines. Participant codes are ordered by protocol group: Group A {1A,3,5,6,7,11,13,14,15,16}, Group B {1B,2,12,17}, Group C {4,8,9}, Y {10}, and Z {18}.

