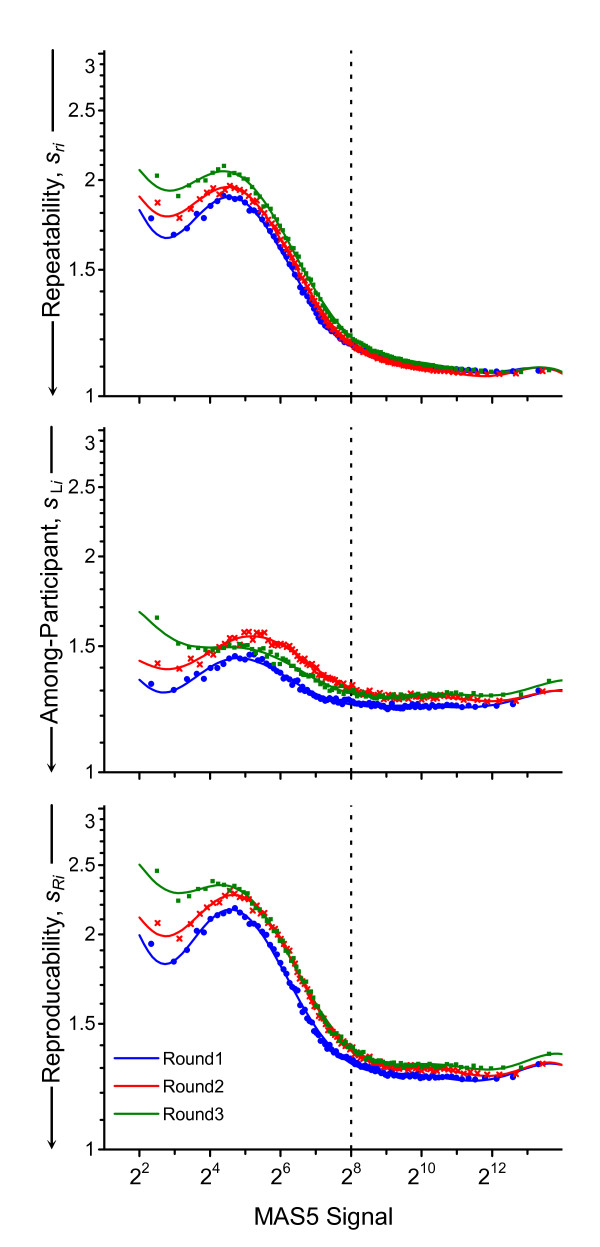
Figure 4.
Change in precision over time. These panels redisplay the precision functions shown in the right-side panels of Figure 2 but grouped by the type of estimate rather than by round to facilitate quantitative comparison of change with time. The dotted vertical line denotes the median signal level, 28.

