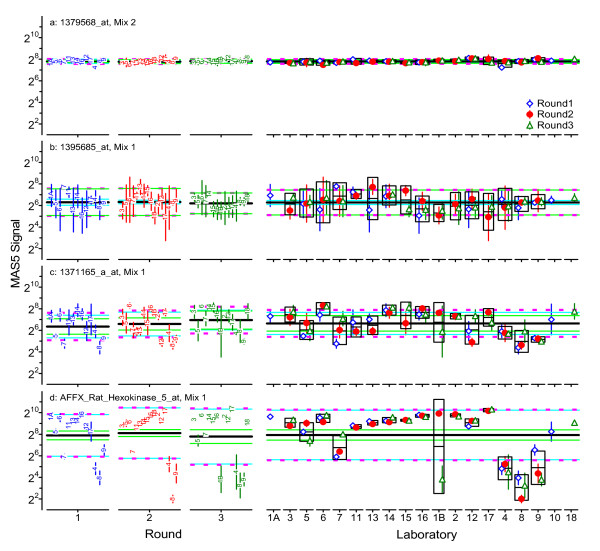
Figure 8.
Example graphical analysis of within-round precisions for individual probesets. This "dot-and-bar" chart provides a graphical summary of the participant averages,  , and standard deviations, s(x1i), for the four probesets labeled in Figure 7. The within-round averages,
  , are represented as a thick black line; the repeatabilities, sr1, as solid green lines one precision unit on either side of average; the between-participant precision, sL1, as solid light-blue lines; and the reproducibilities, sR1, as dashed magenta lines. Participant codes are ordered by protocol group: Group A {1A,5,6,7,11,13,14,16}, Group B {12,17}, and Group C {4,8,9}.

