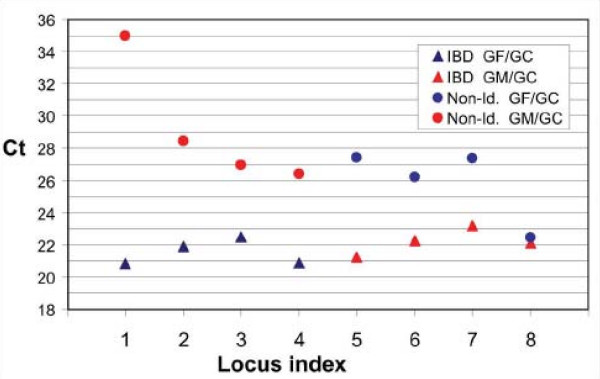
Figure 4.
Quantitative PCR detects an extensive range of enrichment of IBD DNA. Eight CA microsatellite sites were assayed by qPCR using a universal (CA)n-specific probe and IBD-enriched DNA from complementary grandparent-grandchild pairs. Loci 1–4 represent shared loci for the grandfather-grandchild pair and loci 5–8 represent shared loci for the grandmother-grandchild pair. Ct is the cycle number at which a common threshold level of amplification was achieved.

