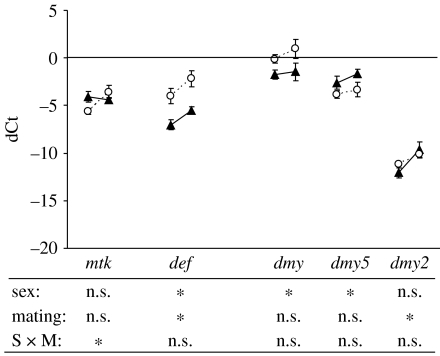
Figure 2.
Expression patterns (relative to actin-5)±s.e. of five humoral genes from the Toll pathway for males (triangles) and females (circles) as virgins (left data point) and 6 hours after mating (right data point). Below are the significant tests of a two-way model I ANOVA with sex (male versus female) and mating treatment (virgin versus mated) as fixed effects. The asterisks indicate a significant difference at α=0.05. See table 1 for gene abbreviations and table S2 for statistical information.

