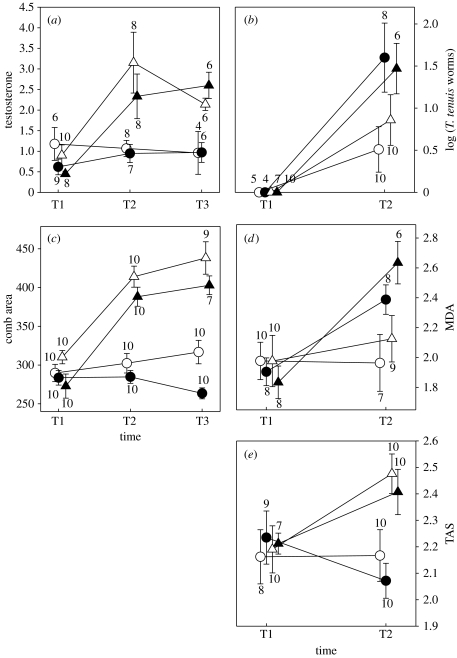
Figure 1.
Effects of hormone and parasite treatments on changes over time in mean±s.d. (a) Plasma concentration of testosterone (ng ml−1), (b) T. tenuis nematode abundance (log-transformed number of worms per male), (c) comb area (mm2), (d) plasma concentration of MDA (nmol ml−1) and (e) TAS (mmol ml−1). S1, first sampling (immediately prior to treatments); S2 and S3, subsequent samplings, 10 and 17 days later. Sample sizes refer to the number of males. Open circles, T−P− males; filled circles, T−P+ males; open triangles, T+P− males; filled triangles, T+P+ males.

