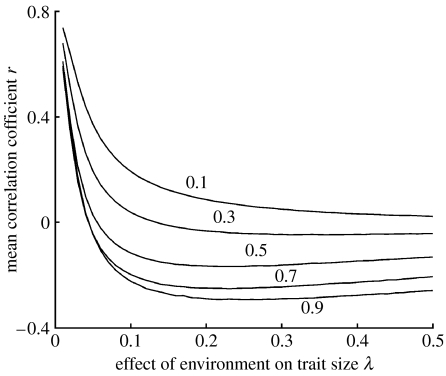
Figure 2.
Mean correlation coefficients r for the relationship between the genetic quality ai and the trait size Si in adult populations surviving mortality during development from 1000 simulations using a model with a multiplicative exponential function for Si (equation (2.2)), and a range of values for the effects of the environment on survival β and trait size λ. Numbers next to lines indicate values of β.

