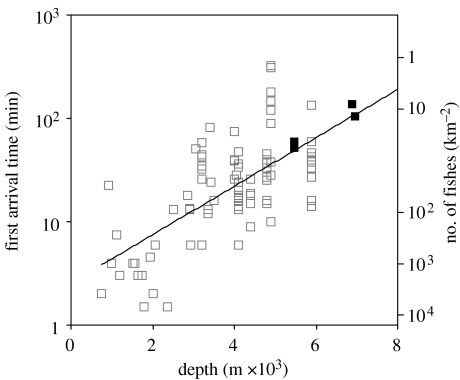
Figure 5.
Arrivals of fishes at bait as a function of depth. Time from touchdown to arrival of the first individual. White squares are data from previous studies at shallower depths (tarr=2.5537e0.0005393D, n=82, R2=0.43, F=60.03, p<0.0001). Black squares are data from this study. Right-hand scale is the theoretical abundance of fishes calculated from the arrival time data (see text).

