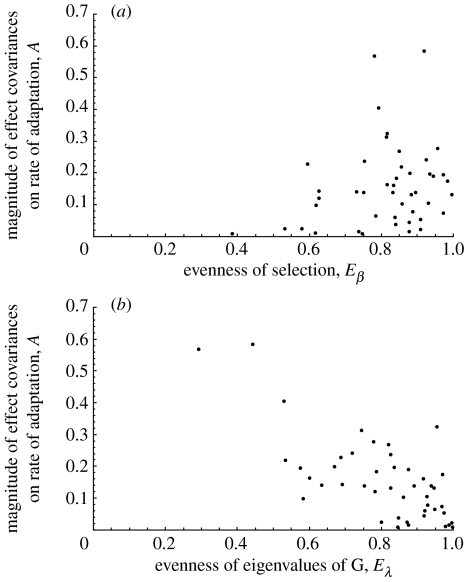
Figure 2.
Assessing the potential for covariances to affect the rate of adaptation. (a) The evenness of selection, Eβ, is plotted against A=|log(R)|. The correlation between Eβ and A is positive (ρ=0.24), indicating that when selection is more evenly distributed across traits, covariances are more likely to affect the rate of adaptation. (b) The evenness of the eigenvalues of the G matrix, Eλ, is plotted A. The negative correlation (ρ=−0.71) confirms that the rate of adaptation is more likely to be altered in cases where correlations cause genetic variation to be more abundant in some directions than others (Eλ≪1). See text for details.

