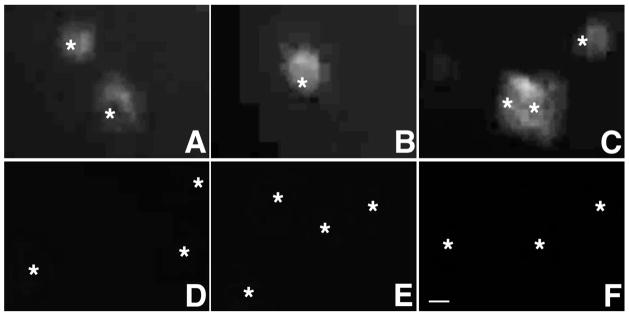
Figure 3.
FcR I, II and III are expressed in cultured microglia. Immunostaining with anti-CD64 (A,D), anti-CD32 (B,E) or anti-CD16 (C,F) shows microglial surface expression of FcR I (A), II (B) and III (C), respectively. Only low levels of FcR I are detected after FcR block by anti-CD32/CD16 (5 μg/ml, D–F). Asterisks show position of cell nuclei. Bar, 10 μm.

