
Figure 1.
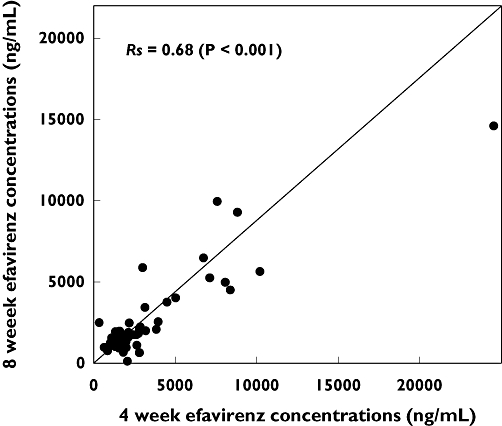
Correlation of mid-dose efavirenz concentrations in plasma from 65 human immunodeficiency virus-infected Ghanaian patients measured 4 weeks (abscissa) and 8 weeks (ordinate) after commencing treatment. Shown are the Spearman correlation coefficient (Rs) and associated P-value for the correlation analysis, and the line of identity representing perfect correlation