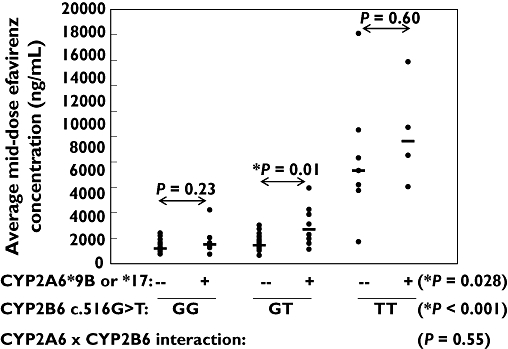
Figure 3.

Influence of CYP2A6 slow metabolizer genotypes (*9B and/or *17) and CYP2B6 c.516G→T genotypes on efavirenz mid-dose concentrations (average of 4-week and 8-week samples). Shown are the P-values from the two-way anova (including analysis of gene–gene interactions) and post hoc multiple pair-wise comparisons (Student–Newman–Keuls test) within genotype groups
