
Figure 4.
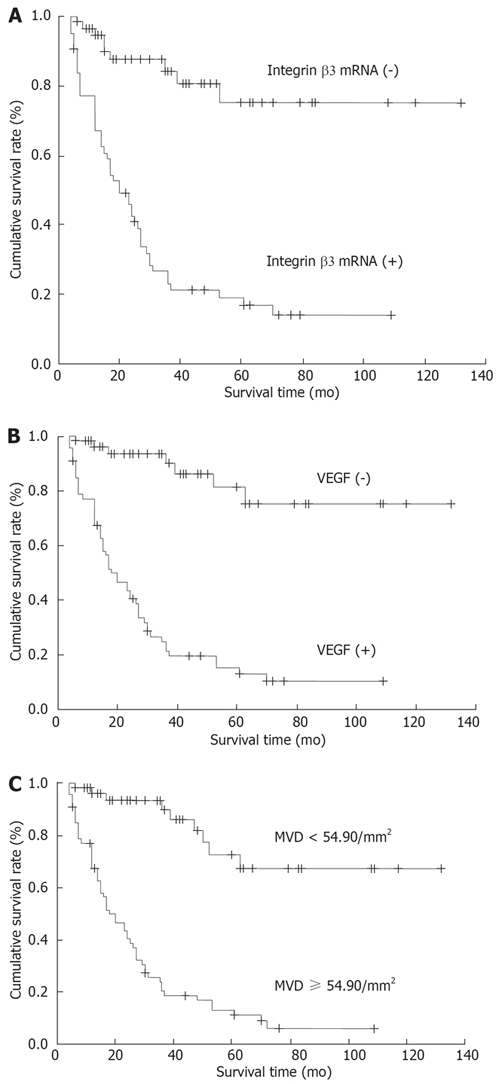
Kaplan-Meier survival curves. A: Survival curves with positive and negative integrin β3 mRNA expression in gastric adenocarcinoma (P < 0.05); B: Survival curves with positive and negative VEGF expression in gastric adenocarcinoma (P < 0.05); C: Survival curves with MVD ≥ 54.90/mm2 and < 54.90/mm2 in gastric adenocarcinoma (P < 0.01).