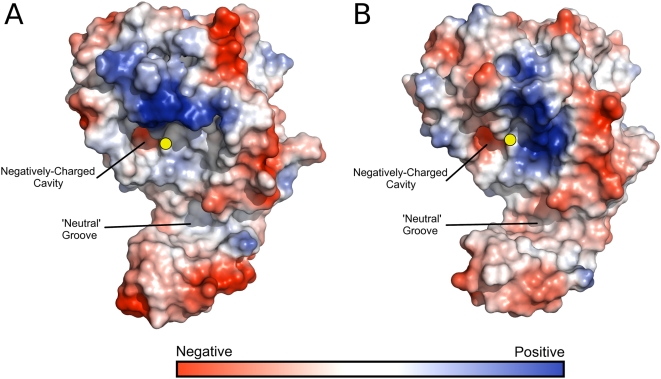
Figure 3. Electrostatic potential surfaces of Cif proteins.
(a) CifPl (b) CifBp. Solvent-accessible surfaces were calculated with a 1.2 Å solvent probe radius. Surface colourings are contoured over the same range for each structure (−90 to +90 kbT/ec). The location of the catalytic cysteine residue is shown by the yellow sphere.

