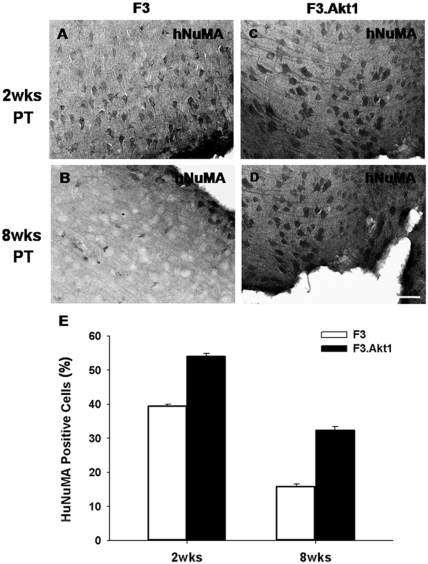
Figure 5.
At 2 weeks post-transplantation (PT) in the hemorrhage core border areas, difference in number of human nuclear matrix antigen (hNuMA)-positive cells between ICH-F3 control group (A) and ICH-F3.Akt1 group (C) is not apparent, but at 8 weeks PT number of hNuMA-positive cells is much higher in F3.Akt1-ICH group (D) as compared to control F3-ICH group (B). Bar indicates 100 µm. E: Percentage of hNuMA-positive cells found in hemorrhage core border area is higher in ICH-F3.Akt1 group as compared to ICH-F3 group at both 2 and 8 weeks post-transplantation.

