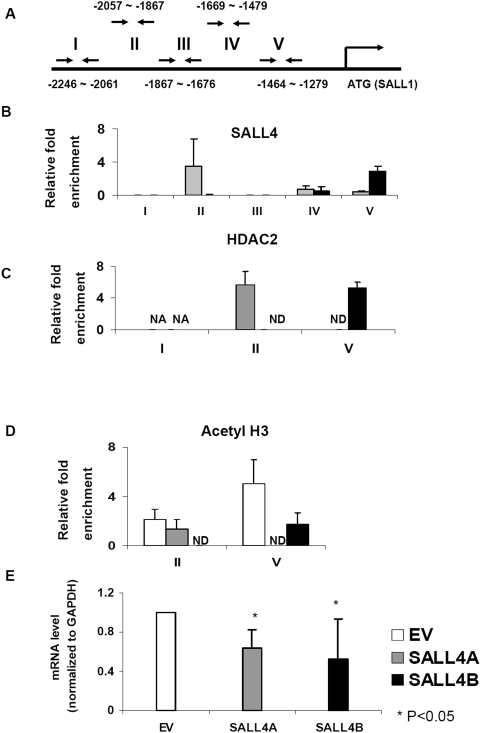
Figure 6. SALL4 co-occupies the same promoter regions of SALL1 as HDAC2 and inhibits its transcription in vitro.
(A) Diagram of SALL1 promoter. Antibody against SALL4 was used to immunoprecipitate DNA fragments from SALL4A and SALL4B-expressed 293T cells and fold enrichment was compared to input after normalization with GAPDH. Five pairs of primers spanning SALL1 promoter region (−2246 bp to −1279 bp) were used in ChIP-qPCR analysis. Region II (−2057 bp to −1867 bp) was found to be bound by SALL4A and region V (−1464 bp to −1279 bp) was found to be bound by SALL4B (B). The same ChIP-qPCR assay was done with an anti-HDAC2 antibody (C) or an anti-acetyl H3 antibody (D). Results are representative of at least two independent experiments. Error bars indicate standard deviations. NA: no amplicon in qPCR. ND: not done. (E) The mRNA level of SALL1 was reduced 35% and 45% in SALL4A and SALL4B-expressed 293T cells (SALL4A and SALL4B) compared to empty vector controls (EV). The expression level was normalized with internal control GAPDH. Data represent as mean±SD, n≥3, P<0.05.

