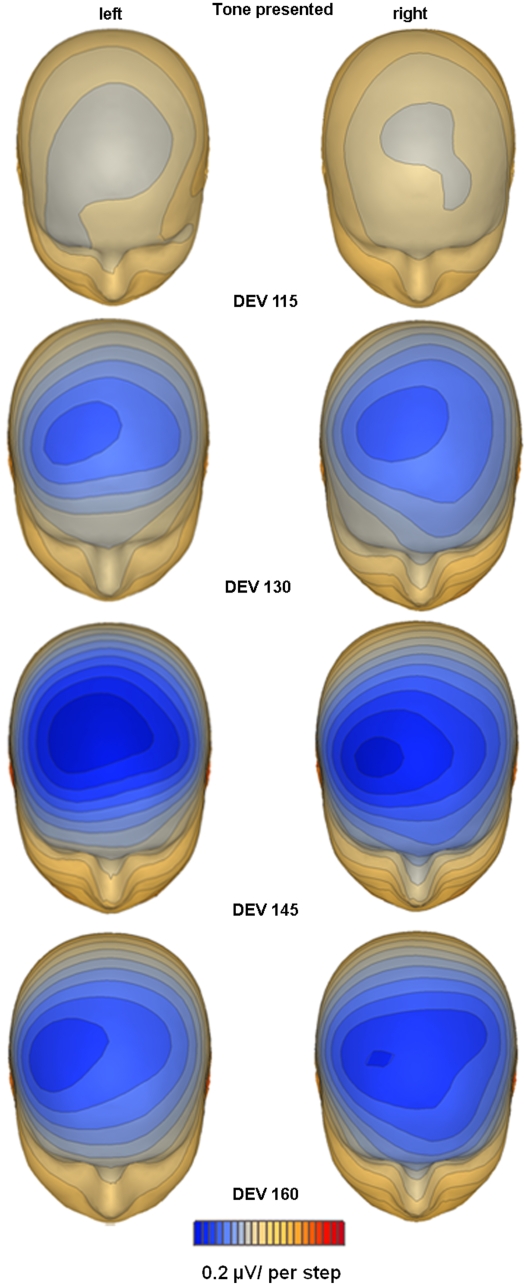
Figure 3.
Topographic mapping of spline-interpolated potential distribution representing the MMN response as subtraction waveform (deviant – standard). The MMN is plotted at peak latency for each ear of delivery and degree of deviance separately. A distinct lateralization of the duration MMN focus over the right hemi-scalp is evident in each condition, except for the condition where no significant MMN activation was evident, e.g. the smallest degree of deviance present to the right ear.

