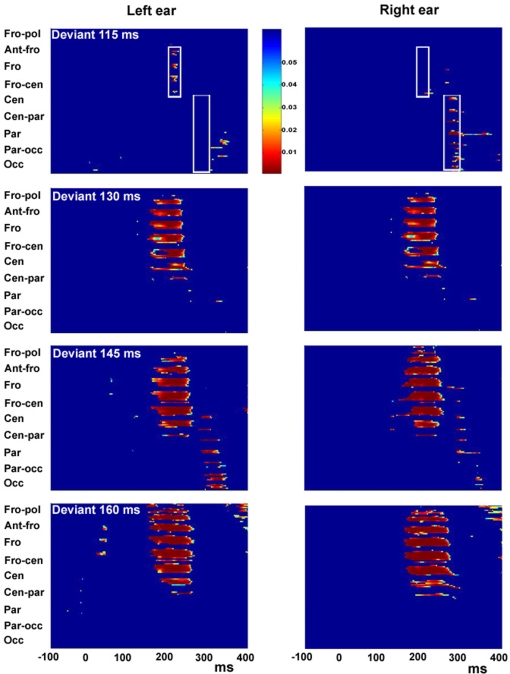
Figure 4.
Statistical cluster plots for degree of duration deviants of 115, 130, 145 and 160 ms presented to the left ear (left panel) and right ear (right panel). Color values indicate the result of pointwise t-tests evaluating differences between standard-tone and deviant-tone ERPs across time (x-axis) and electrode positions (y-axis) for the entire 128-electrode montage. For clarity, only p-values <0.05 are color encoded. Fro-pol, Fronto-polar; Ant-fro, Anterior-frontal, Fro, Frontal; Fro-cen, Fronto-central; Cen, Central; Cen-par, Central-parietal; Par, Parietal; Par-occ, Parietal-occipital; Occ, Occipital.

