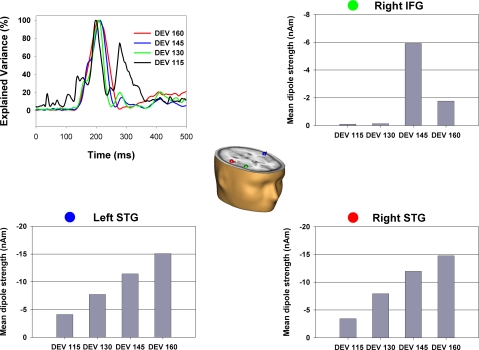
Figure 5.
The dipolar solution of the MMN component with sources bilateral in the superior temporal gyri and right inferior frontal gyrus. Dipoles are shown in the Talairach-transformed brain of an individual subject. Color dots by the graphs illustrating mean dipole strength indicate the corresponding color-matched dipole. For each dipole and degree of deviation source strength was calculated as mean of the corresponding source waveform in a time window from 190 to 240 ms. Mean strength of dipole in the left and right STG increased with degree of deviation. No significant change was observed for the right IFG dipole.

