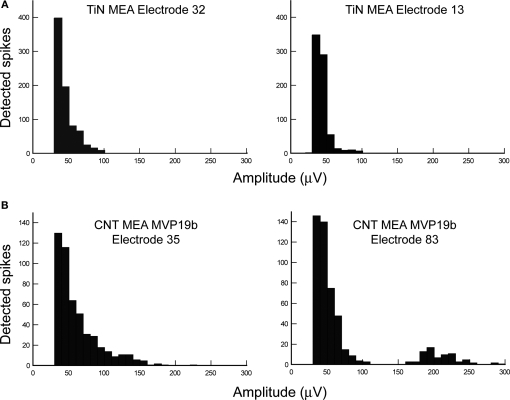
Figure 3.
Comparison of spike amplitude distributions recorded with commercial versus CNT electrodes. (A) Histograms of spike amplitudes recorded from two TiN electrodes on the same MEA. Both distributions look relatively similar, with maximal amplitudes of about 100 μV. (B) Histograms of spike amplitudes recorded from two CNT electrodes on the same MEA. The amplitude distributions are broader than with TiN electrodes, starting from similar values (25–35 μV), but reaching much higher values (175 μV for electrode 35 and 290 μV for Electrode 83).

