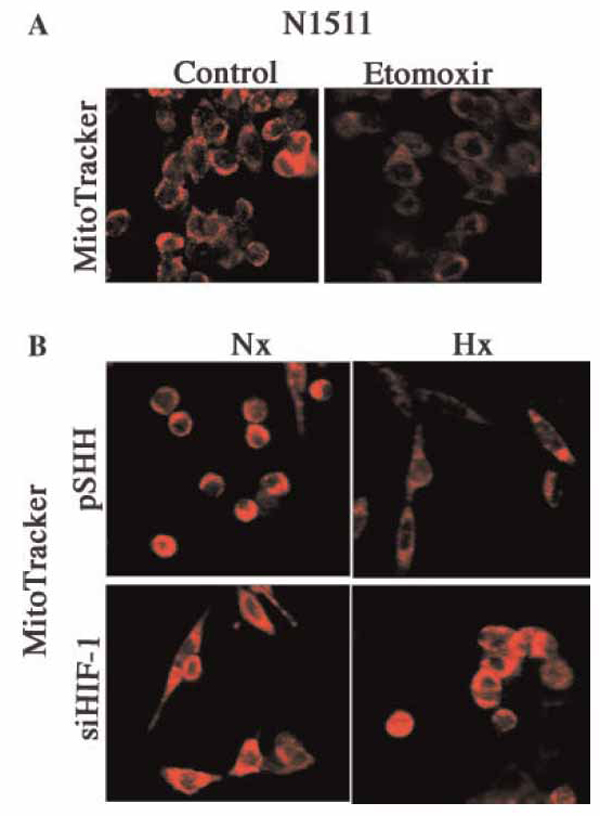
Figure 3. UCP3 regulation of chondrocyte mitochondrial membrane potential in HIF-1 suppressed cells.

(A) UCP3 activation leads to a reduction in the mitochondrial trans membrane potential. N1511 chondrocytes were cultured under normoxic conditions and UCP3 was activated using etomoxir. The mitochondrial membrane potential was monitored using Mitotracker Red. Note the reduction in Mitotracker fluorescence upon etomoxir treatment. (B) Maintenance of the mitochondrial transmembrane potential by HIF-1 silenced chondrocytes in hypoxia. Control (pSHH) cells and HIF-1 silenced chondrocytes were cultured under either normoxic (20% O2) or hypoxic (2% O2) conditions. Membrane potential was visualized using Mitotracker Red. Note the reduction in fluorescence in control cells in hypoxia. HIF-1 silenced cells do not display the reduction in the transmembrane potential.
