
Fig 2.
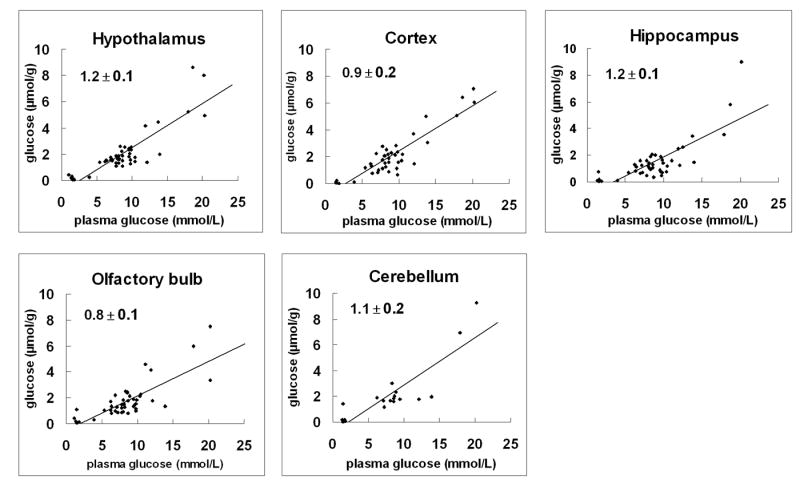
Relationship between brain and plasma glucose concentration from anatomically and functionally distinct brain regions. Regression lines of plots show the best-fit of the model of glucose transport (as described in Material and Methods) to the data points measured biochemically over an extended range of plasma glucose levels (∼ 1.4 to 22 mM). All brain regions showed near linearity. The mean values of the slope ± SD by brain region are indicated. Linear regression plots were then used to determine the kinetic parameters, Kt and Tmax/CMRglc (see text). > 40 independent glucose measurements were performed per brain region except for cerebellum (N = 19).