
Fig 3.
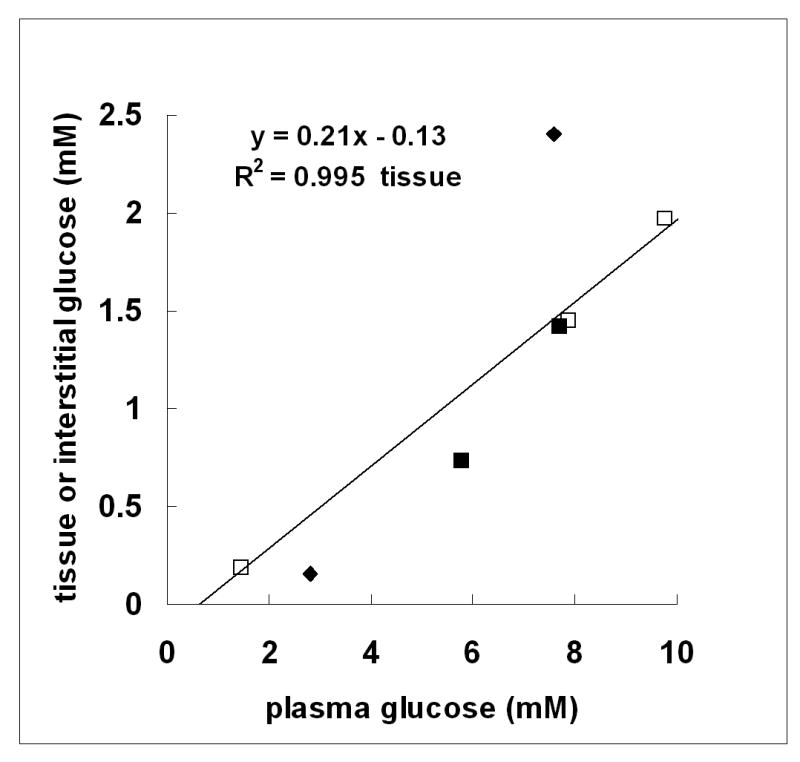
Comparison of tissue and interstitial glucose concentration for hypothalamus as a function of plasma glucose. The concentrations of hypothalamic glucose (open squares) were those determined in the present study (Fig 2) at plasma glucose concentrations (in mM) of 1.5 ± 0.03; 7.9 ± 0.1; 9.8 ± 0.1; n=5 per point. Interstitial glucose concentrations: zero-net flux in unrestrained rats (closed squares) from (de Vries et al. 2003); and implanted glucose microelectrodes in pentobarbital-anesthetized rats (closed triangles) from (Silver and Erecinska 1994). R2 refers to hypothalamic tissue glucose.