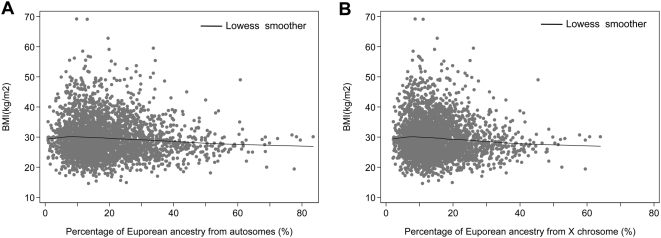
Figure 1. Scatter-plots of BMI vs. the estimated percentage of European ancestry.
(A) Percentage of European ancestry was estimated based on the autosomes. (B) Percentage of European ancestry was estimated based on chromosome X. Data are plotted using 20% of the samples (selected at random) for better visualization.

