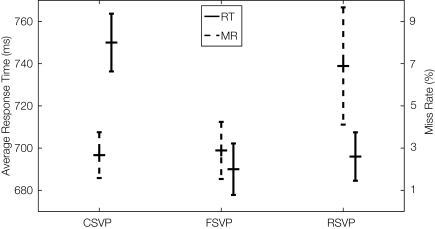
Figure 2.
Group results showing miss rates (MRs) and response times (RTs) to targets for the three types of stimuli. The solid lines show the mean RT (labeled on the left Y-axis of the figure) to the three types of targets, with the error bars indicating the 95% confidence interval of the mean RT (the standard error is computed on a within-trial basis). The dashed lines represent the miss rate for each type of target stimuli (labeled on the right Y-axis), and the error bars show the 95% confidence interval of the average miss rate for within-subject measures.

