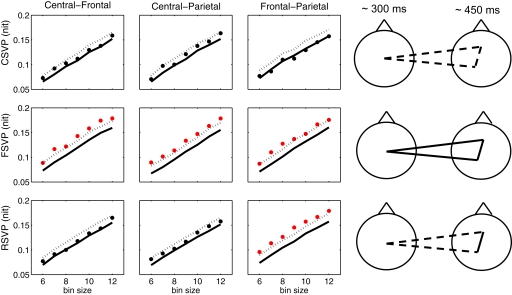
Figure 7.
Functional connectivity between electrode clusters assessed via mutual information analysis. Left: The dashed lines show the upper bound of the 95% confidence interval of the group average mutual information computed from a bootstrap procedure (1000 bootstrap samples). The dots show the actual group average mutual information (in nit) for the three pairs of clusters with the number of bins from 6 to 12. The mutual information is considered significant (marked by red) if the dot is above the dashed line. The solid lines show the mean of the mutual information from the bootstrap procedure. Right: A graphical summary of the mutual information between clusters. For each stimulus condition two scalp plots are shown, with the first head representing the temporally-early central cluster, and the second showing the late frontal and left-parietal clusters. Clusters that have mutual information consistently and significantly above chance are connected with a solid line; otherwise they are connected with a dashed line.

