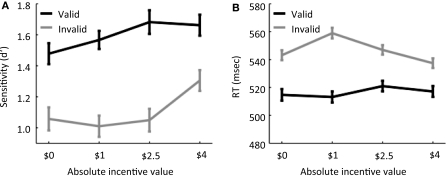
Figure 2.
Behavioral results. (A) Sensitivity, measured via the signal detection theory measure d′, is plotted as a function of absolute incentive magnitude for both valid and invalid trials. (B) Reaction time is plotted as a function of absolute incentive magnitude for both valid and invalid trials. Error bars denote the standard within-subject error term (Loftus and Masson, 1994).

