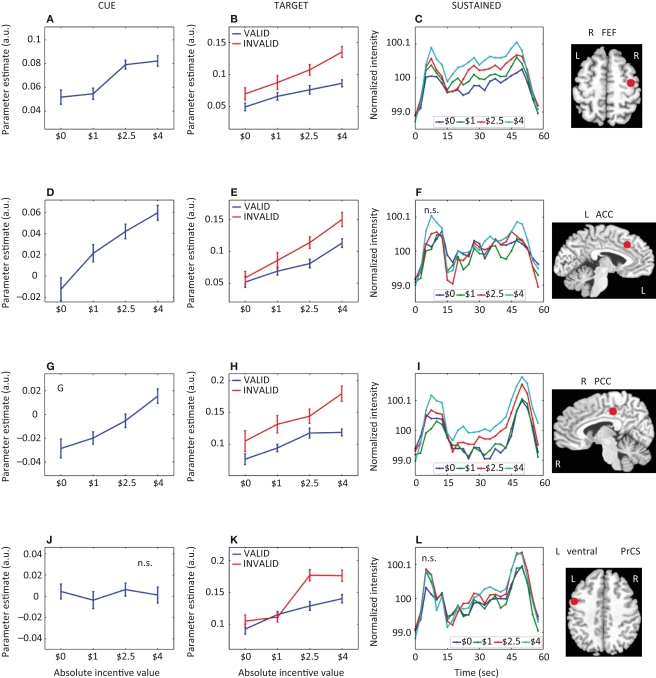
Figure 4.
Parametric effects of absolute incentive magnitude on transient and sustained responses. The insets represent the location of the ROI from which the data plots are based. These plots illustrate the parametric effects observed in Figure 3. Although error bars (standard within-subject error term; Loftus and Masson, 1994), are included, the results should not be interpreted inferentially. ACC, anterior cingulate cortex; FEF, frontal eye field; PCC, posterior cingulate cortex; PrCS, precentral sulcus; A.U., arbitrary units; N.S., not significant.

