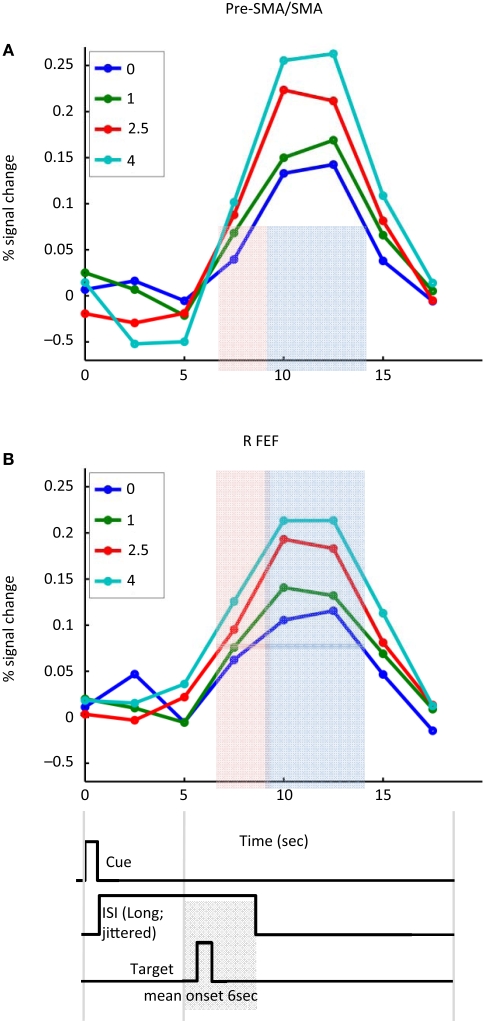
Figure 6.
Cue-sustained responses. Estimated cue-related responses are shown for the left pre-supplementary motor area/supplementary motor area (pre-SMA/SMA) (A) and right frontal eye field (FEF) (B) for trials with long cue-target ISIs (average of 6 s). The light red shaded area indicates the time point that would be expected to reflect cue-sustained signals (based on the canonical hemodynamic response). Because the target stimulus was shown on average 6 s following trial onset (and no earlier than 5 s), the impact of the target would be expected to be observed during the time points indicated in light blue. Note that sustained cue responses were sensitive to absolute incentive magnitude. No assumptions about hemodynamic shape were made in the estimation of the time course. The timing diagram of the events is approximate and cue/target ISIs were “long” (5–8 s; mean target onset time is diagrammed).

