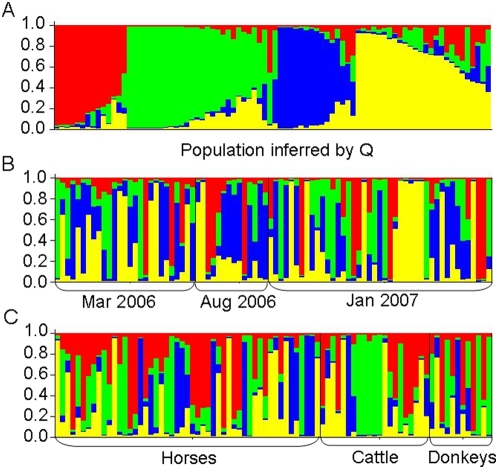
Figure 2. Estimated population substructure (n = 84).
Each individual is represented by a vertical bar, divided into four coloured segments that represent the proportion of the genotype for that individual that derives from each of the four clusters (Q), four being the estimated number of subpopulations as detected by STRUCTURE. A is ordered by Q (red = W, green = X, blue = Y, yellow = Z). In B and C, individuals are ordered along the x axis according to sampling date (B) or host species (C).

