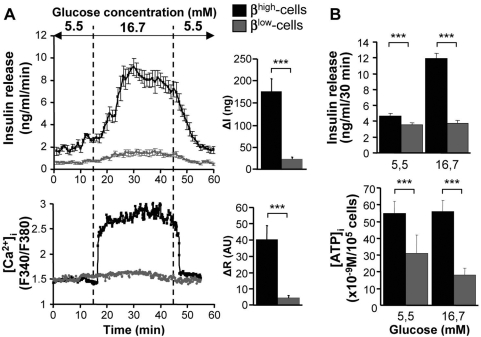
Figure 3. βlow-cells exhibit altered Ca2+ and ATP signaling in response to glucose.
(A) Insulin release (top panel) and cytoplasmic calcium concentration ([Ca2+]i) oscillations (bottom panel) in response to 5.5 mM and 16.7 mM glucose in βhigh and βlow-cells during perifusion experiments (n = 3–6). Quantification of insulin and calcium responses to stimulating glucose are represented by ΔI and ΔR respectively. (B) Insulin release (top panel) and intracellular ATP ([ATP]) levels (bottom panel) in response to 5.5 mM and 16.7 mM glucose in βhigh and βlow cells assessed by static incubation experiments (n = 2). n represents the number of independent cell preparations from 6 pooled rats each. Data are means±SEM. ***, p<0.005.

