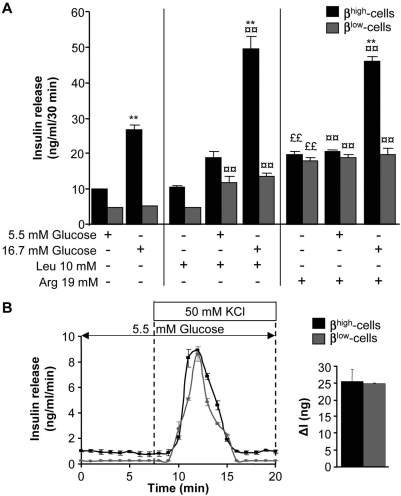
Figure 5. βhigh and βlow-cells respond equally to depolarizing agents but differently to metabolizable secretagogues.
(A) Effects of 5.5 mM and 16.7 mM glucose±10 mM leucine (Leu) or 19 mM arginine (Arg) on insulin release in βhigh and βlow-cells (n = 3–5). Data are means±SEM. *, p<0.05 and **, p<0.01 for stimulating conditions (16.7 mM glucose±Arg or Leu) compared to basal conditions (5.5 mM glucose±Arg or Leu). ¤, p<0.05 and ¤¤, p<0.01 between treated (glucose+Arg or Leu) and non-treated conditions (glucose alone) for same glucose concentrations. ££, p<0.01 for Arg or Leu alone compared to 5.5 mM glucose alone. (B) Insulin secretory response to 5.5 mM glucose±50 mM KCl in βhigh and βlow-cells (n = 3–5). Quantification of insulin response to KCl is represented by ΔI. Data are means±SEM. *, p<0.05 between βhigh and βlow-cells. n represents the number of independent cell preparations from 6 pooled rats each.

