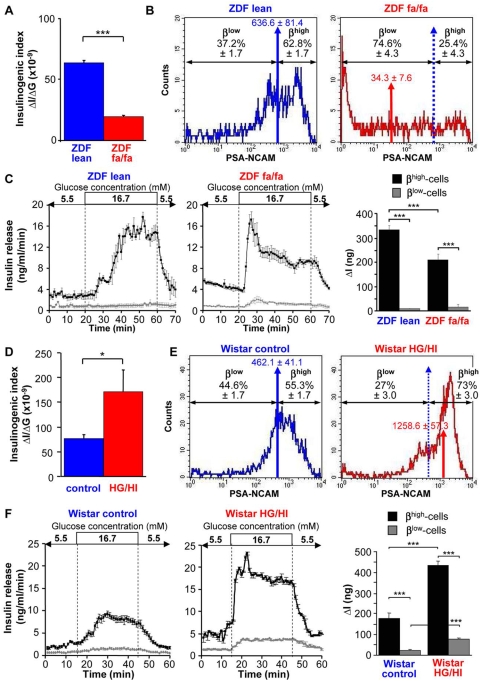
Figure 7. The change in βhigh to βlow-cell ratio correlates with the change in β-cell function in animal models with increased insulin demand.
(A) Insulinogenic index (ΔI/ΔG) after OGTT in ZDF fa/fa rats compared to ZDF lean controls (12 rats). (B) Representative FACS analyses of dissociated islet cells in type 2 diabetic ZDF rat, a model of loss of β-cell function. The geometric mean of PSA-NCAM fluorescence is represented by a blue arrow in control ZDF lean rats and by a red arrow in diabetic ZDF fa/fa rats. The distribution of βhigh and βlow-cells is determined by the geometric mean of PSA-NCAM of the control ZDF lean rats (blue arrows) and expressed in percent of total β-cells (n = 3–6). (C) Insulin release in response to 5.5 mM and 16.7 mM glucose in βhigh and βlow-cells of ZDF rats during perifusion experiments (n = 3–6). Quantification of insulin response to stimulating glucose is represented by ΔI. (D) Insulinogenic index (ΔI/ΔG) after OGTT in HG/HI rats compared to saline-infused controls (Wistar control). (E) Representative FACS analyses of dissociated islet cells in HG/HI rats and Wistar control rats. The geometric mean of PSA-NCAM fluorescence is represented by a blue arrow in saline-infused Wistar control rats and by a red arrow in HG/HI rats. The distribution of βhigh and βlow-cells is determined by the geometric mean of PSA-NCAM of the control Wistar rats (blue arrows) and expressed in percent of total β-cells (n = 3–6). (F) Insulin release in response to 5.5 mM and 16.7 mM glucose in βhigh and βlow-cells of control and HG/HI rats during perifusion experiments (n = 3–6). Quantification of insulin response to stimulating glucose is represented by ΔI. n represents the number of independent cell preparations from at least 6 rats pooled each. Data are means±SEM. *, p<0.05; ***, p<0.005.

