
Fig. 1. Microarray analysis comparing GPCR expression between fetal adrenal (FA) and adult adrenal (AA).
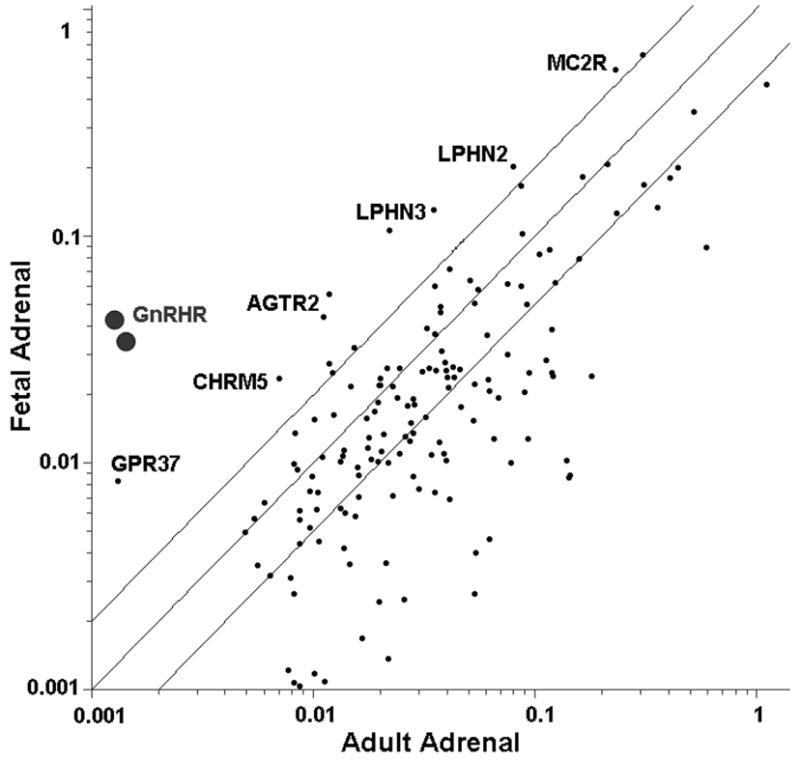
Total RNA from pools of three fetal and three adult adrenals was used for oligonucleotide microarray analysis. The graph represents 165 GPCR that were found to have a signal which indicated that it was present in at least one tissue sample. The transcripts with the highest variation between the FA and AA are labeled.