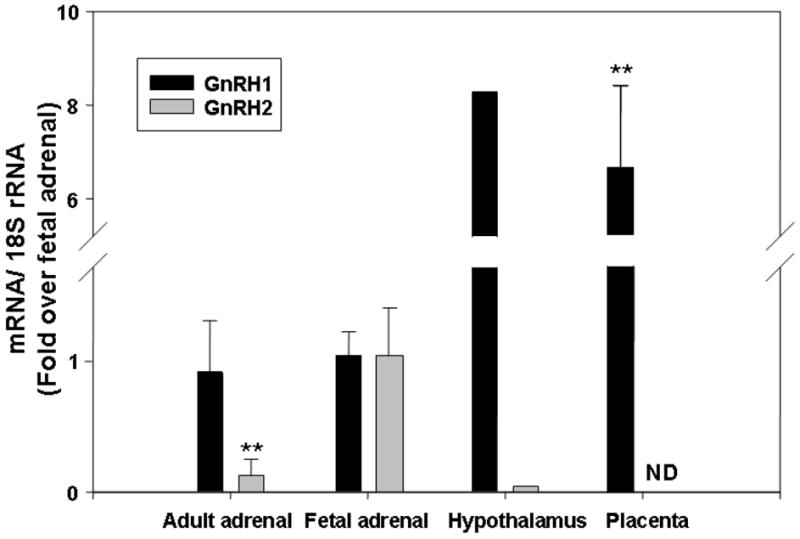
Fig.6. GnRH1 and GnRH2 mRNA expression levels in different tissues.

Quantitative PCR was performed to detect GnRH1 and GnRH2 transcript expression in FA, AA, hypothalamus and placenta. All the results were normalized to 18S rRNA as internal control. Data are expressed as fold over fetal adrenal levels and are presented as the mean ± SD of values from at least three different samples (**, P<0.01).
