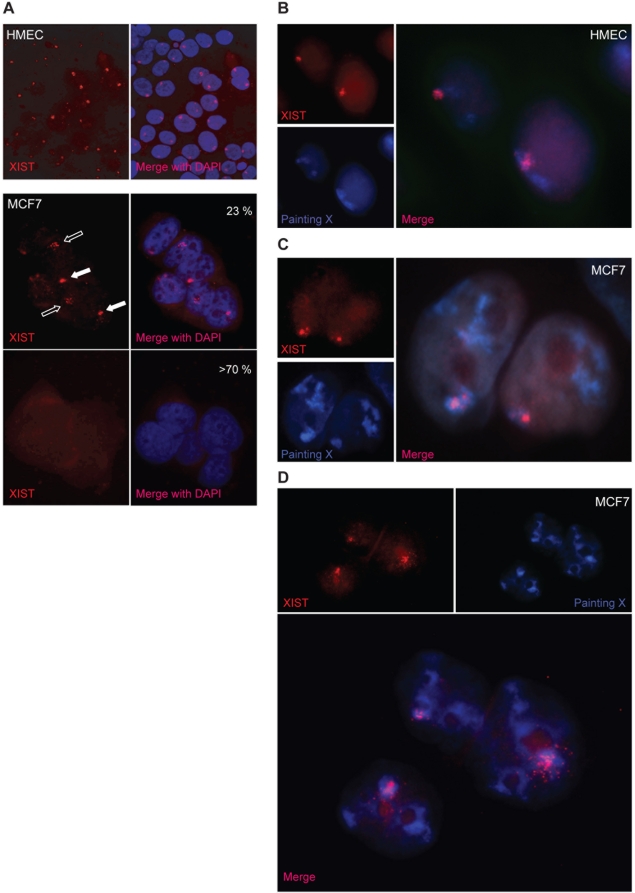
Figure 3. XIST RNA behaviour in HMEC and in MCF7 breast cancer cell line.
A) Localisation of XIST RNA (red signal) revealed by RNA-FISH on HMEC and MCF7 nuclei (DAPI staining). The percentages of XIST-positive (middle) and XIST-negative (bottom) MCF7 nuclei are reported. Positive cells show different XIST distribution, clustered clouds (full arrows) or dispersed signals (empty arrows). B–D) Localisation of XIST RNA (red) respect to nuclear X chromosome territories (blue) revealed by FISH analysis in HMEC and MCF7 nuclei. MCF7 XIST-positive nuclei always show three X chromosome domains. In MCF7 nuclei the overlap between XIST and X chromosome territory appears more limited (panel C), respect to HMEC (panel B) and very often spreads outside the X chromosome domain (panel D).

